5 Top Growth Takeaways from XYPN's 2023 Annual Benchmarking Study
Share this
Seven years ago XYPN started conducting an annual benchmarking survey of its members to provide data-backed firm journey analysis for fee-for-service financial planning firms. With each year, the resulting Benchmarking Study has painted a clearer and more intricate picture for planners looking to map out their own firm journeys during their implementing, building, and scaling phases.
The survey focuses on revenue and expenses, client services, sources of clients/business, and pricing. Each piece of information is tracked year-over-year to show trends and provide fee-only financial planning firm owners with key metrics which they can measure their own businesses against.
During XYPN LIVE 2023, XYPN Co-founders Alan Moore and Michael Kitces recorded a live episode of XYPN Radio where they reviewed the study's highlights. Alan and Michael pulled five graphs to spotlight what’s working and not working for member firms. The episode tells the data-backed story of an XYPN firm's journey, from the average growth in revenue, client profitability, and client relationships, to staff productivity.
Give the episode a listen here, and check out some of the highly anticipated figures and highlights below:
Figure 1: Median Annual Growth Rate of Client Household Relationships since 2018
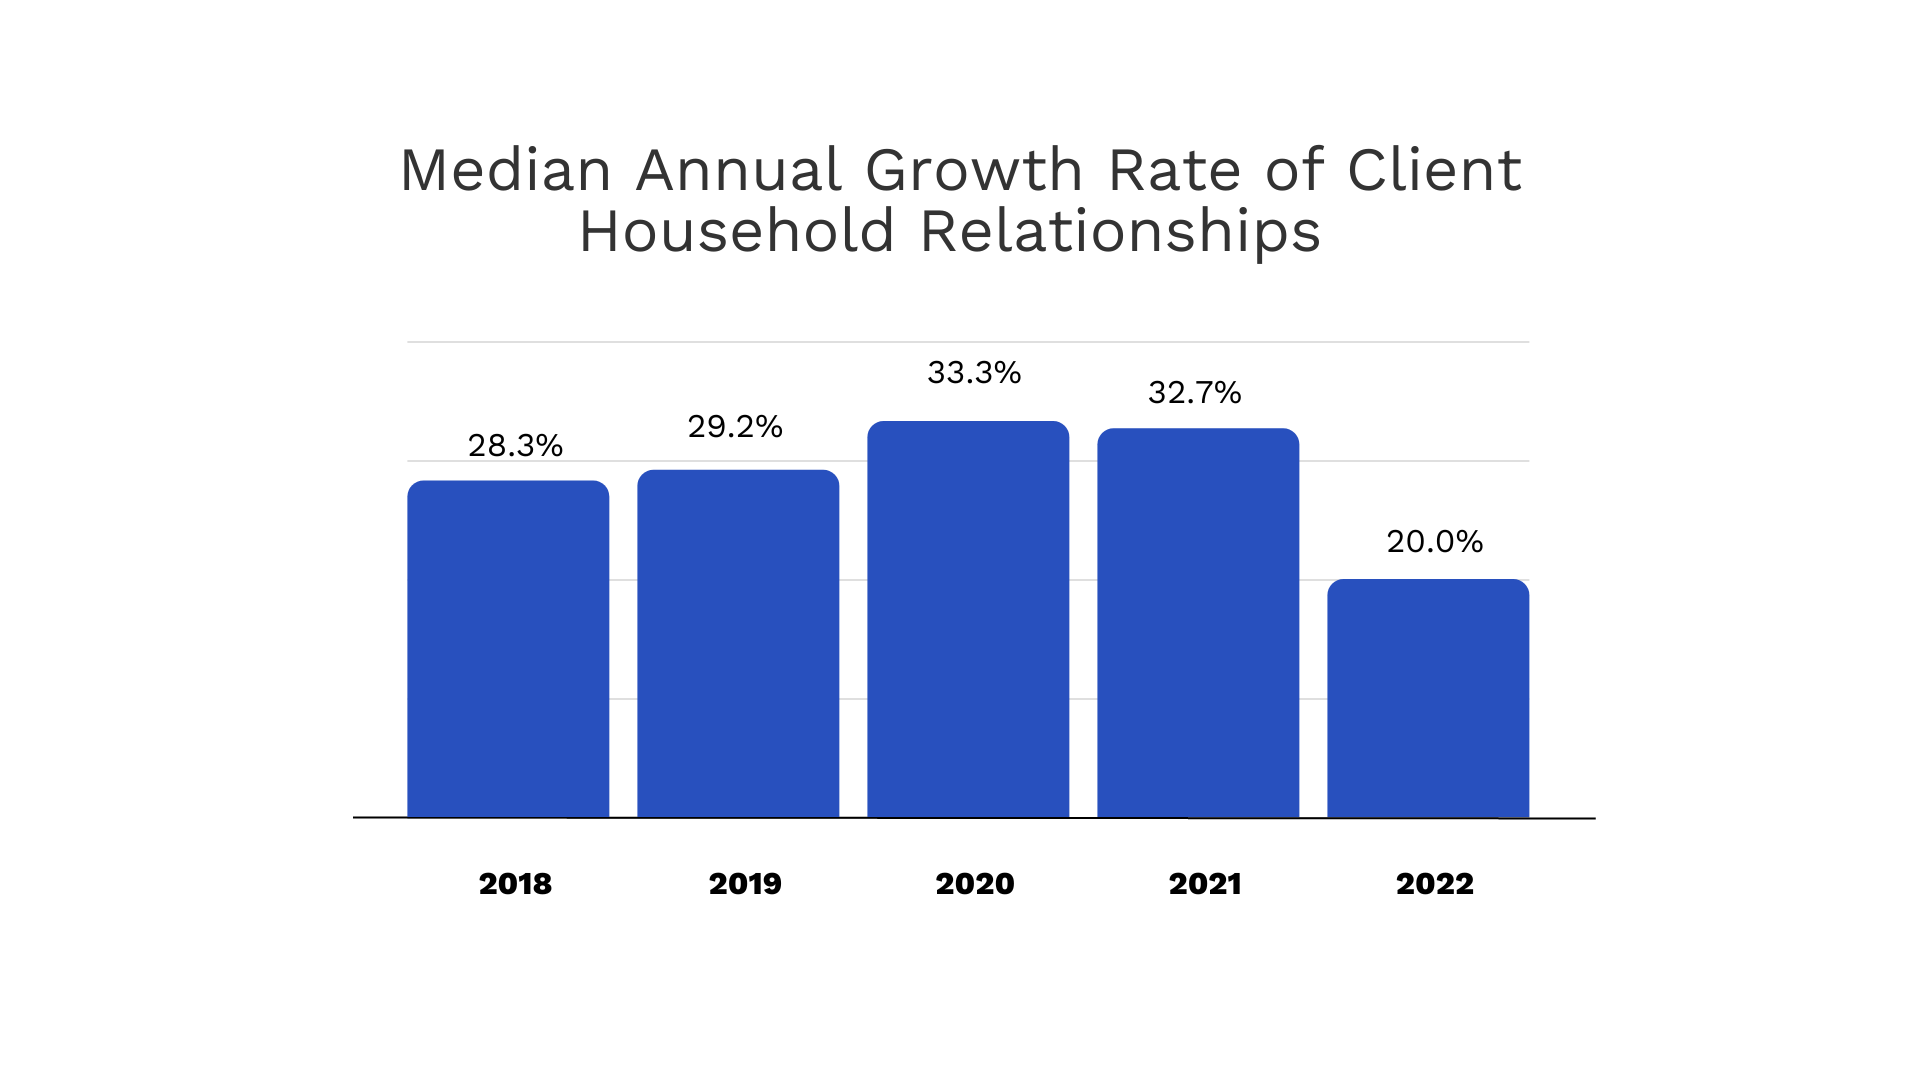
The first graph that was reviewed was Figure 1, which explored the median annual growth rate of client-household relationships since 2018. Kitces shared that this is “one of the best ways to understand in the purest sense what growth looks like in the fee-only space.”
XYPN members have seen an impressive 28% average growth rate over 5 years but suffered a slight decrease in 2022. Why? Michael and Alan discussed the current environment and how market cycles affect growth—including how interest rate sensitivity can lead to an overall slowdown of new client growth. But don’t get too worried about the dip, as they reassured the packed room, “This too shall pass.”
Figure 2: Average Annual Revenue for Members Who Joined With Few Clients
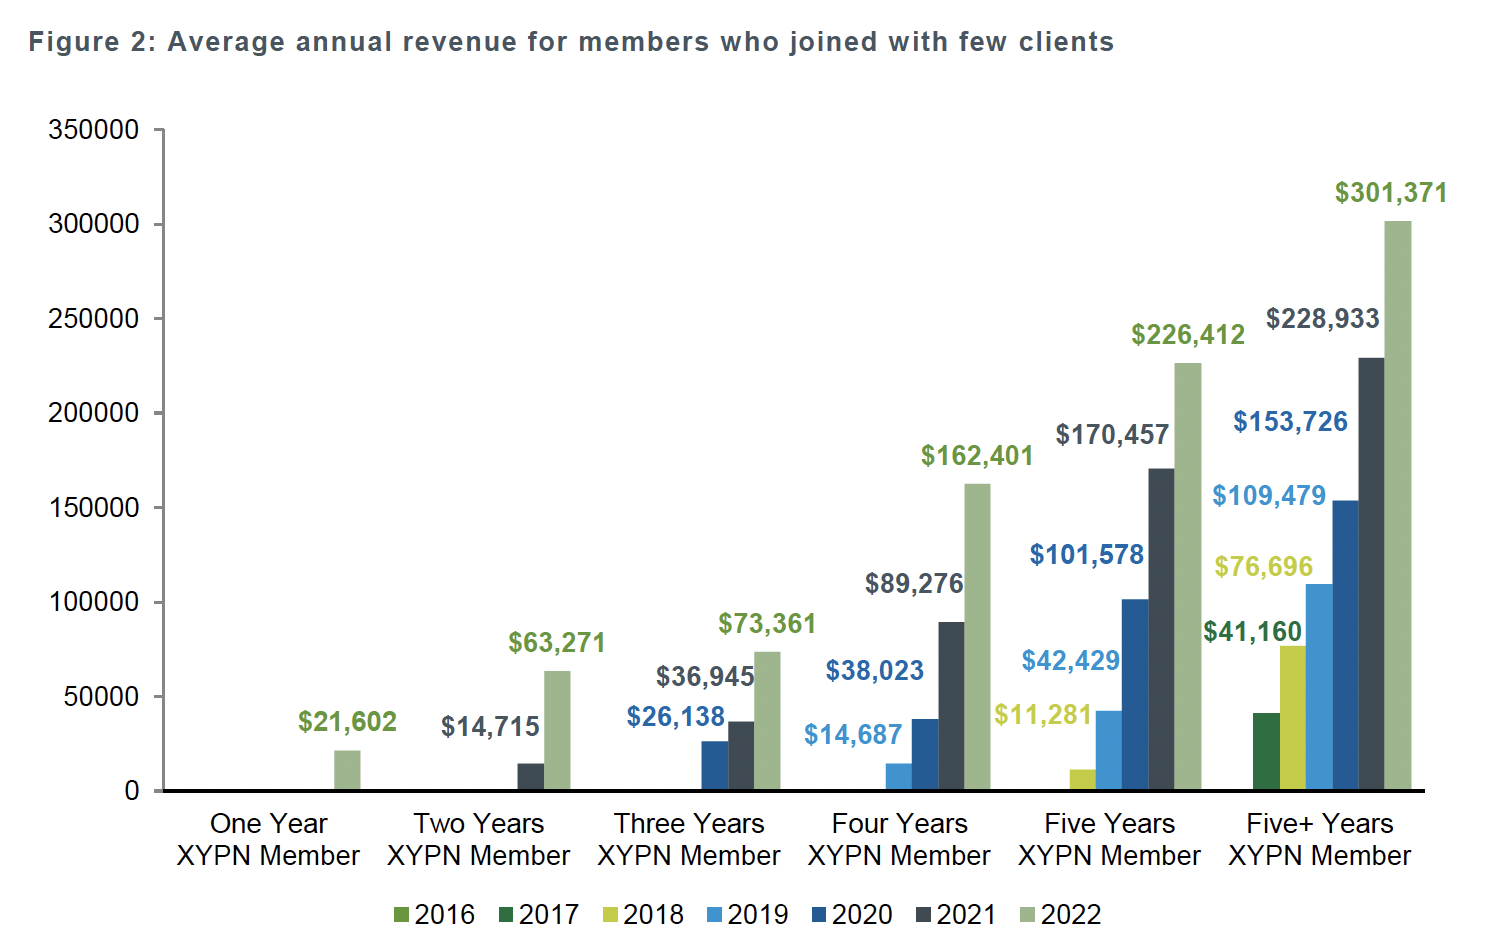
Figure 2 covered the average annual revenue for members who joined with few clients. On average, this graph helps answer the question about how XYPN members are doing. You’ll see that more growth happens in the 4th year than in the first 3 years combined. Why? It takes time to be known, liked, and trusted.
It can be hard to accelerate at first. Some advisors get there faster because they are breaking away from another firm and taking existing clients with them, but if you are truly starting from scratch, this is the path XYPN has seen advisors take over and over again.
Figure 11: 2022 Revenue Growth by Niche Focus for Members Joining with Few Clients
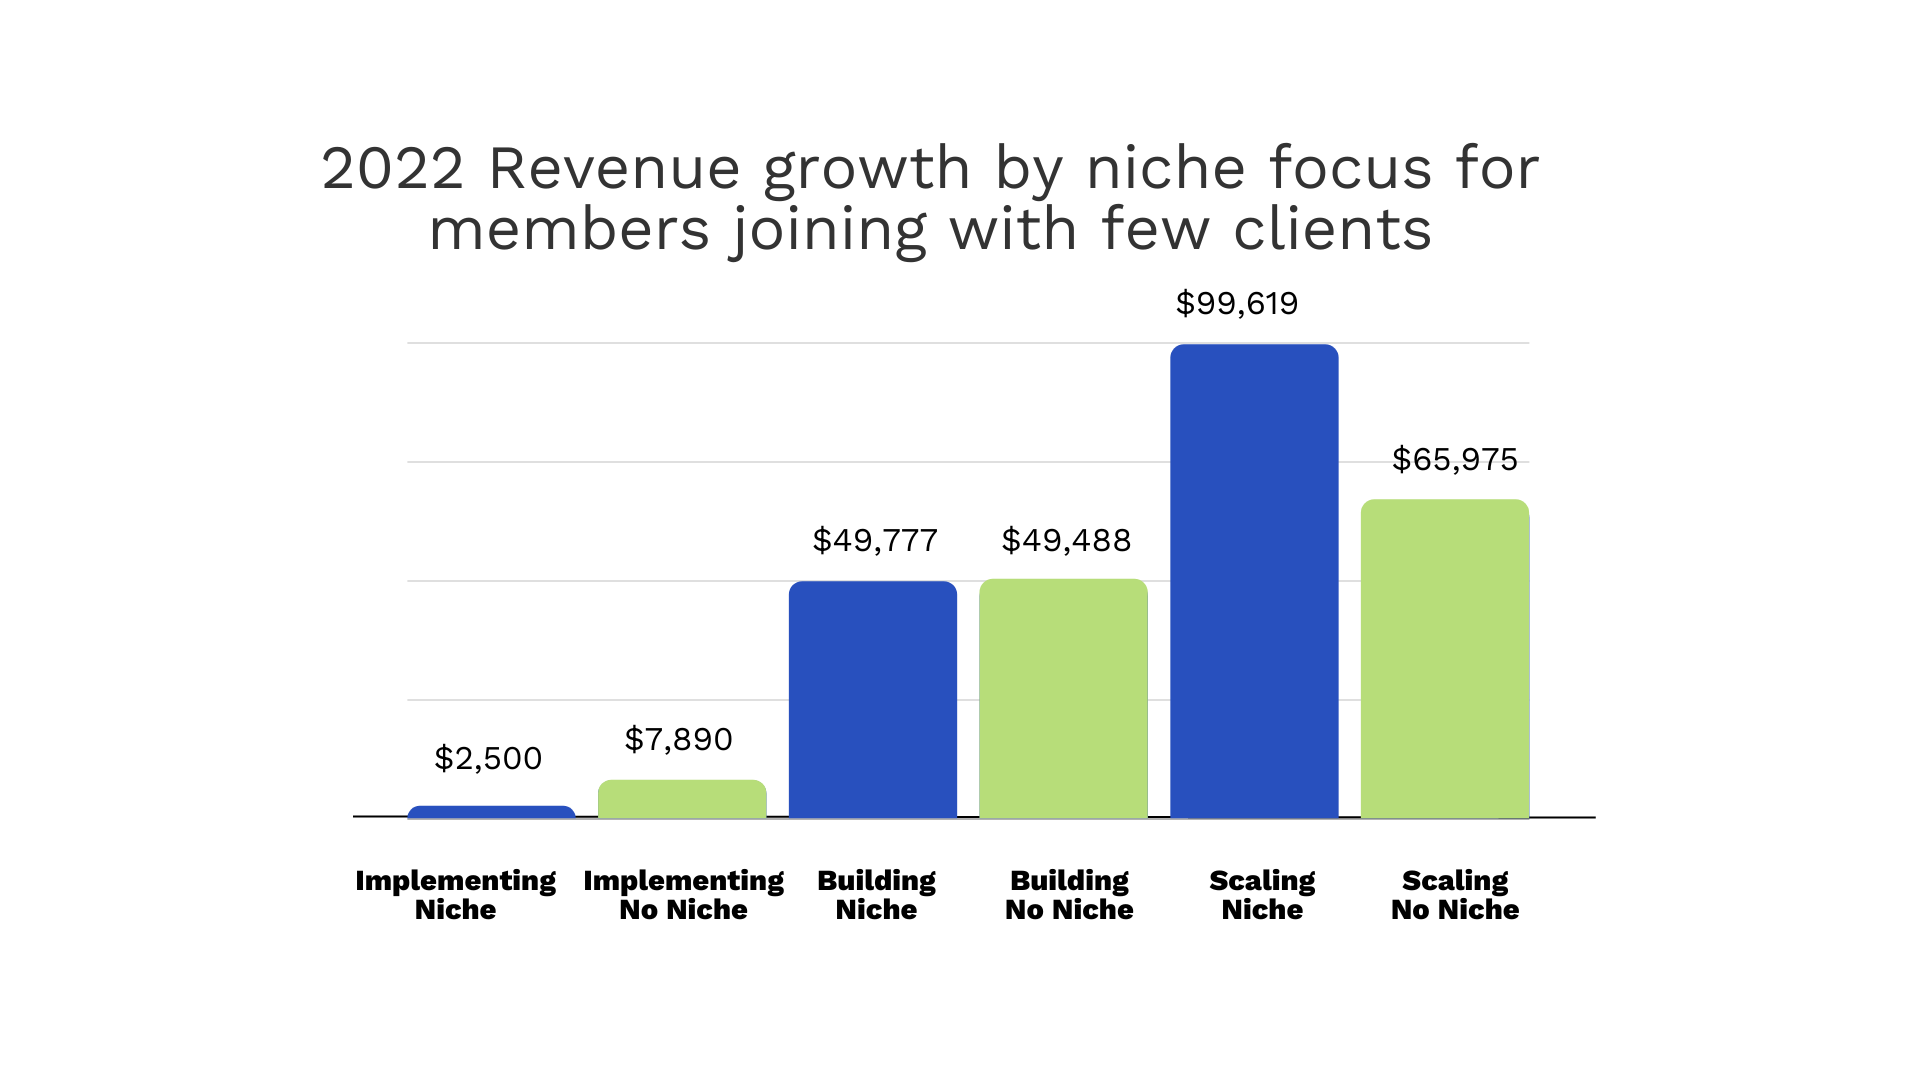
There’s one big takeaway from Figure 11…riches are in the niches! It’s clear you can grow a successful financial planning practice when you have a niche focus. Looking further, in the Implementing (5-20 clients) and Building (20-75 clients) phase, having a niche or not having a niche is neither holding you back nor accelerating your growth. But, in the Scaling phase (75+ households), the data shows there is significant growth when you focus on a niche.
Alan and Michael reiterate that they’ve never heard anyone say they niched too soon or too narrowly, but they have heard folks say they wish they had niched sooner. The most successful firms are the ones where all of their processes and marketing are geared toward their niche and not focused on anyone outside of that. Working with anyone else almost feels uncomfortable because it’s different from the usual processes. Choosing a niche helps you to be clear with who you work with, and why.
Figure 22: Percentage of Advisors Leveraging In-House or Outsourced Staff and Number of Clients
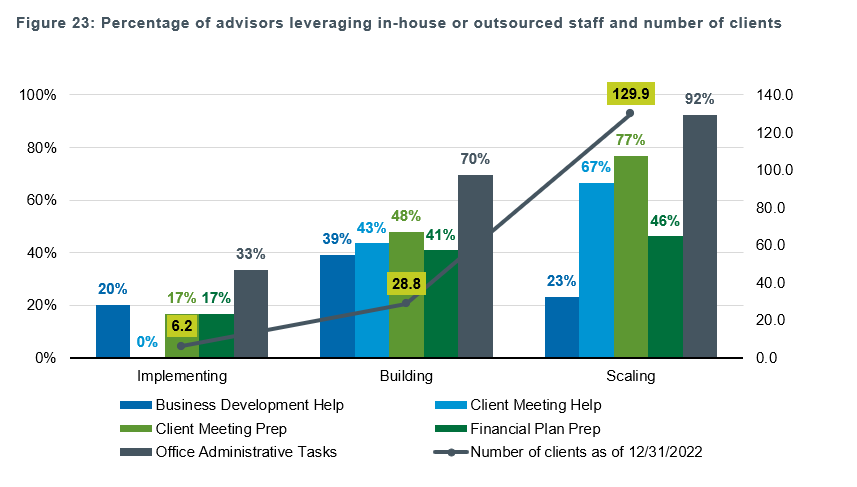
Figure 22 dove into the percentage of advisors who are leveraging in-house or outsourced staff and the average number of clients during each business stage. Let’s cover the average number of clients in each phase first:
Implementing phase: Average of 6.2 clients
Building phase: Average of 28.8 clients
Scaling phase: Average of 129.9 clients
This graph shows which areas of the business advisors are hiring help, including Business Development, Client Meeting Prep, Office Administrative Tasks, Client Meeting Help, and Financial Plan Help.
According to the graph and data, it’s clear firms are outsourcing more and more over time.
Hiring and outsourcing help is happening the quickest with administrative work, such as paperwork—no surprise there! Administrative work can be outsourced at a lower cost and are those not-so-fun tasks most don’t enjoy doing. Financial planning prep help is happening the slowest, which is a hiring cost.
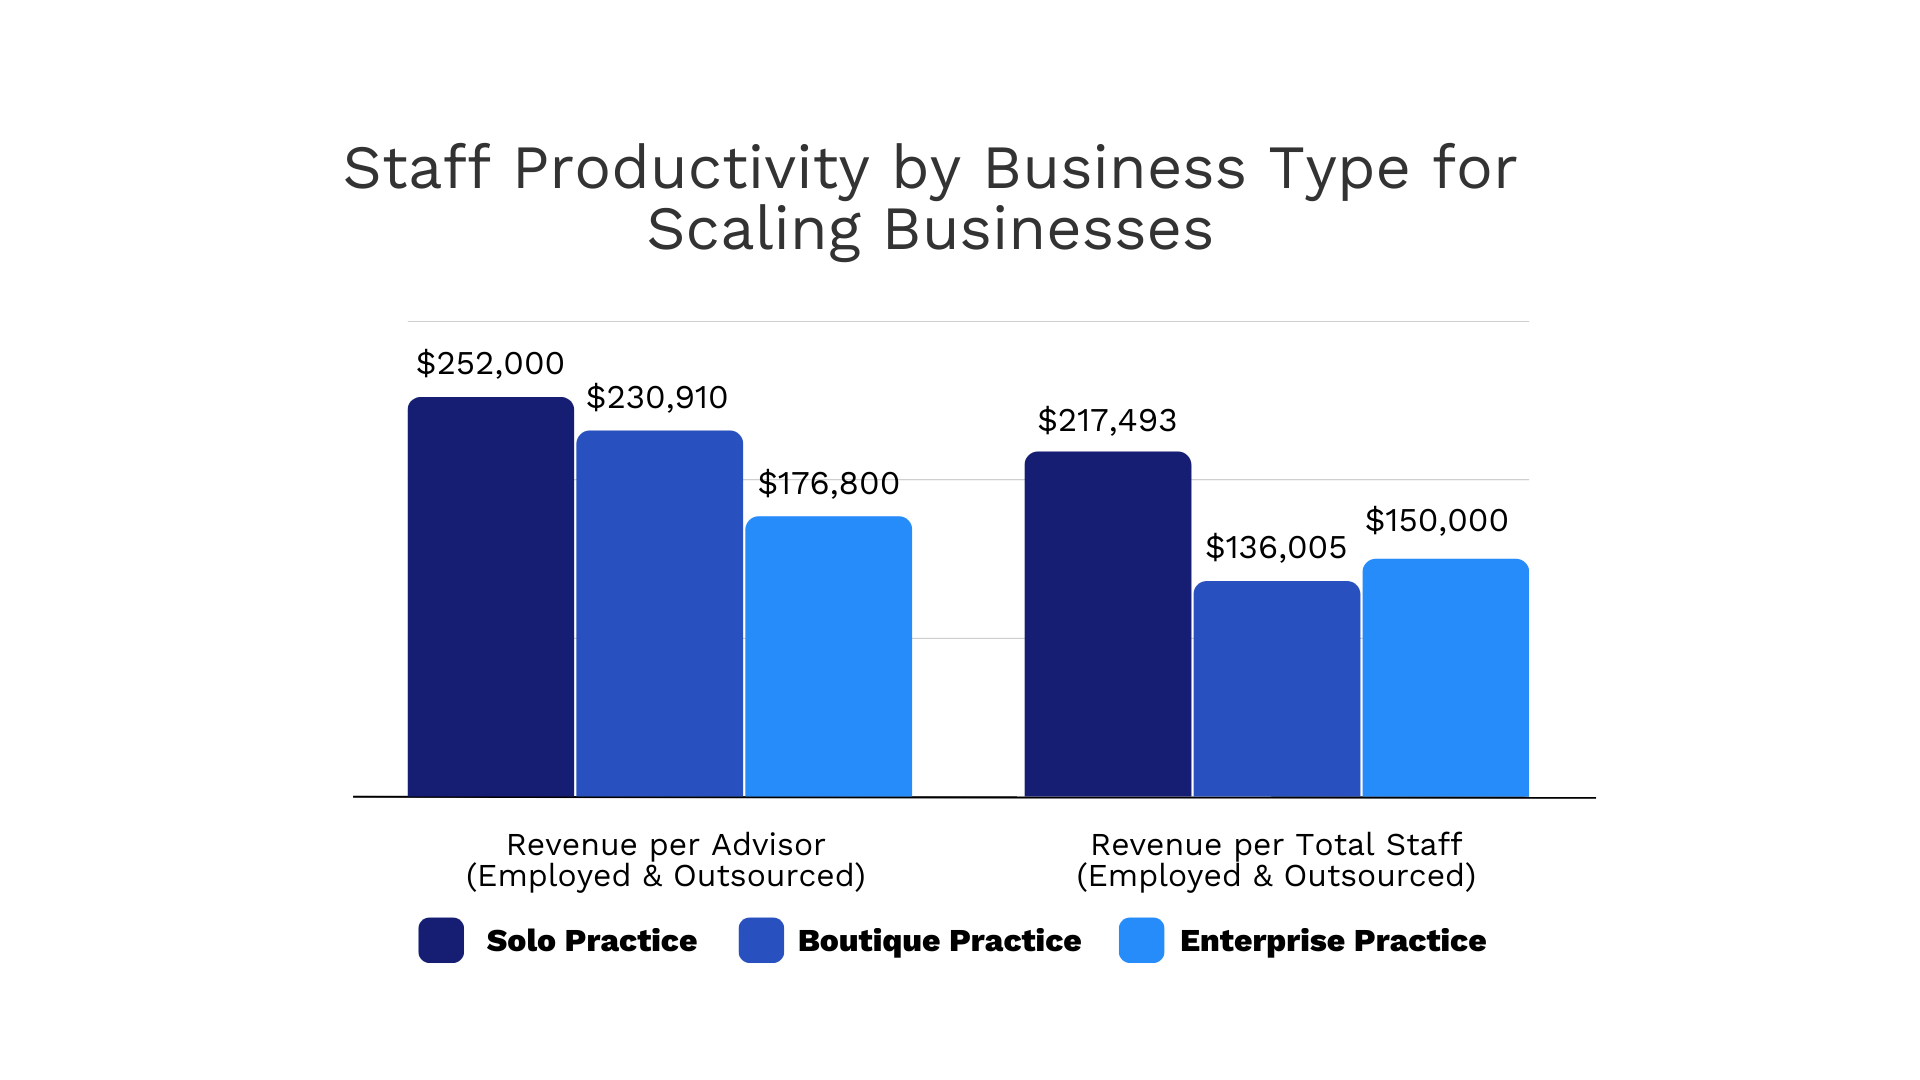
Figure 31: Staff Productivity by Business Type for Scaling Businesses and Table 8: Staff Capacity Ratios by Business Phase
|
Capacity Ratio |
Implementing |
Building |
Scaling |
|
Clients per advisor (employed and outsourced) |
20 |
26 |
38.9 |
|
Clients per total staff (employed and outsourced) |
13.3 |
7.9 |
20 |
|
Total clients (median) |
8 |
30 |
116 |
The end of the episode focuses on two graphs, Figure 31: Staff Productivity by Business Type for Scaling Businesses and Table 8: Staff Capacity Ratios by Business Phase.
Figure 31 measures the different types of firms between solo (1 advisor), boutique (multi-advisor), and enterprise (building & scaling towards 20+ employees) and the revenue per advisor. In the purest sense, this graph is a measure of productivity.
We see the solo practice earning the most per advisor, the boutique making a little less, and then the enterprise firm making the least. In reality, this graph should be going in the opposite direction, up and to the right as you scale. The core concern here is that the firms who are growing, are seeing their revenue per advisor numbers drop when they should be going up. This means firms are hiring associate advisors who are then doing a lot of non-client, non-revenue generating activities, vs. helping to grow the business by meeting with clients.
These are just a handful of the meaningful takeaways from XYPN’s Annual Benchmarking Study. The study also provides a glimpse into client service models and how they have progressed, more detailed information on what fees are being charged, and insights into what Building and Scaling firms are doing to accelerate their growth and profitability. If you’re a member of XYPN, check out the full study in XYPN Academy.

About the Author
After getting her start as a Network Navigator on Team XYPN and then joining the Marketing team as an Email Marketing Manager, Lindsey White now manages all things optimization in her role as XYPN's Senior Sales & Marketing Operations Manager. She is (almost) as passionate about creating and optimizing processes as she is about growing the movement; lucky for her, she gets to do it all here at XYPN.
Share this
- Advisor Blog (724)
- Financial Advisors (246)
- Growing an RIA (128)
- Business Development (98)
- Digital Marketing (97)
- Marketing (94)
- Community (82)
- Coaching (76)
- Start an RIA (76)
- Running an RIA (72)
- Compliance (71)
- Client Acquisition (68)
- Technology (67)
- Entrepreneurship (64)
- XYPN LIVE (64)
- Fee-only advisor (49)
- Sales (49)
- Bookkeeping (46)
- Client Engagement (45)
- Practice Management (44)
- XYPN Books (43)
- Scaling an RIA (42)
- Investment Management (41)
- Financial Education & Resources (33)
- Client Services (31)
- Employee Engagement (31)
- Lifestyle, Family, & Personal Finance (31)
- Market Trends (28)
- Journey Makers (26)
- Process (18)
- Niche (13)
- SEO (9)
- Career Change (8)
- Partnership (8)
- Sapphire (7)
- Transitioning Your Business (7)
- Persona (4)
- Social Media (4)
- Transitioning To Fee-Only (4)
- Emerald (3)
- Transitioning Clients (3)
- Onboarding (2)
- RIA (2)
- Transitioning to a Corporate RIA Affiliation (1)
Subscribe by email
You May Also Like
These Related Stories

5 Noteworthy Trends from XYPN's Annual Benchmarking Survey
Sep 19, 2019
6 min read

Top 5 Growth Hacks from XYPN's 2024 Annual Benchmarking Study
Dec 4, 2024
8 min read


.png?width=600&height=400&name=PW%20%20Insider%20Insights%20YT%20Thumbnail%20Image%201920%20%C3%97%201080%20px%20(1).png)

